Multiple Choice
The scatterplot shows monthly sales figures (in units) and number of months of experience for a sample of salespeople. 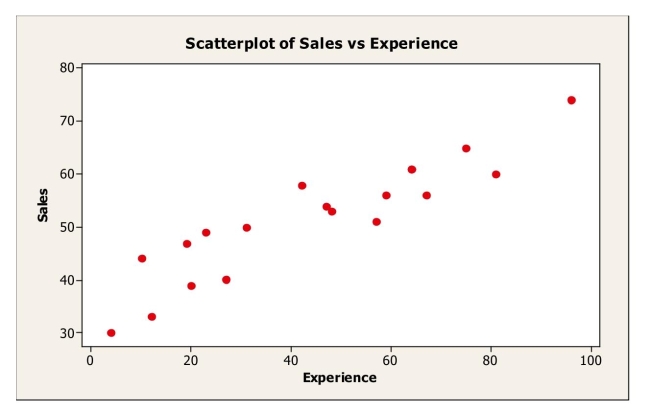 The correlation between monthly sales and level of experience is most likely
A) -.235.
B) 0.
C) .180.
D) -.914.
E) .914.
Correct Answer:

Verified
Correct Answer:
Verified
Q1: For the following scatterplot, <img src="https://d2lvgg3v3hfg70.cloudfront.net/TB5782/.jpg" alt="For
Q2: A small independent organic food store offers
Q4: A company studying the productivity of its
Q4: Consider the following to answer the question(s)
Q7: A small independent organic food store offers
Q8: Data were collected on monthly sales revenues
Q10: Shown below is a correlation table showing
Q11: Based on the following residual plot, which
Q17: Consider the following to answer the question(s)
Q19: A supermarket chain gathers data on the