Multiple Choice
Using the frequency table below, determine the relative frequencies for Apartment and Townhouse
Listings. 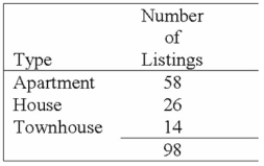
A) .5000 and .5000
B) .5000 and .2653
C) .2653 and .1429
D) .1429 and .2495
E) .5918 and .1429
Correct Answer:

Verified
Correct Answer:
Verified
Related Questions
Q7: The following represent the ages of students
Q9: (i.. The stem in a stem-and-leaf display
Q23: In a frequency distribution, what is the
Q34: In a simple Frequency Polygon, where is
Q89: What is the relative frequency for those
Q90: The monthly salaries of a sample of
Q92: The grades on a statistics exam for
Q95: What is the relative frequency for those
Q96: The chart below can be best described
Q98: Given the following stem and leaf plot,