Multiple Choice
The chart below can be best described as 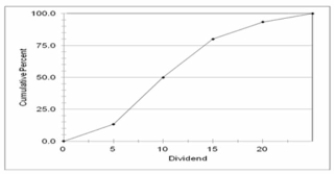
A) Frequency Polygon
B) Cumulative frequency polygon
C) Clustered bar chart
D) Stacked bar chart
E) Histogram
Correct Answer:

Verified
Correct Answer:
Verified
Related Questions
Q7: The following represent the ages of students
Q9: (i.. The stem in a stem-and-leaf display
Q23: In a frequency distribution, what is the
Q34: In a simple Frequency Polygon, where is
Q90: The monthly salaries of a sample of
Q92: The grades on a statistics exam for
Q94: Using the frequency table below, determine the
Q95: What is the relative frequency for those
Q98: Given the following stem and leaf plot,
Q100: The chart below can be best described