Multiple Choice
Which is the best (most informative and useful) graphical display of the Average Weekly Earnings
Health Care in Canada over the years 2008 to 2012?
A) 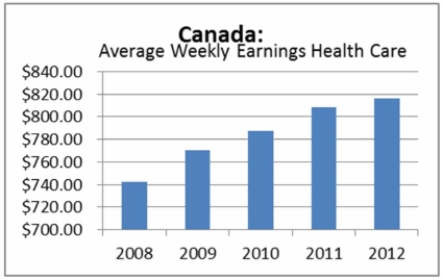
B) 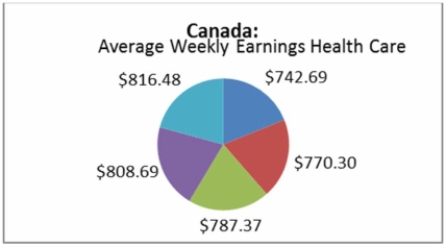
C) 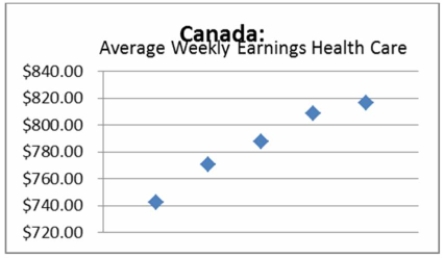
D) 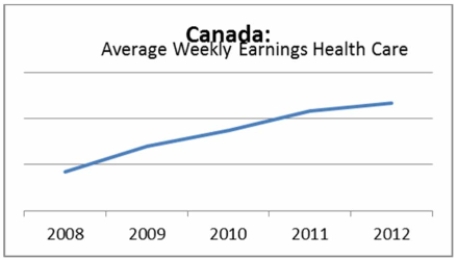
Correct Answer:

Verified
Correct Answer:
Verified
Related Questions
Q10: Refer to the following price of jeans
Q11: Given the following stem and leaf plot,
Q12: For the distribution of ages above, what
Q13: The following ages (rounded to the nearest
Q14: The following ages (rounded to the nearest
Q16: The following represent the ages of students
Q17: What is the following table called? <img
Q18: A group of 100 students were surveyed
Q19: Consider the following stem and leaf plot:
Q20: The chart below can be best described