Multiple Choice
Listed below is the net sales in $ million for Home Depot Inc., and its subsidiaries from 1994 to
2003. 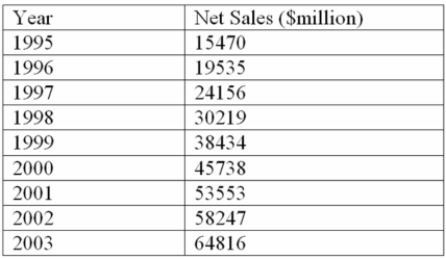
Using the printout below, what are the estimated sales for 2010? 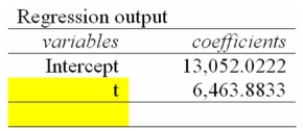
A) $90,618.6 Million
B) $97,082.5 Million
C) $116,464.2 Million
D) $103,546.4 Million
E) $110,010.3 Million
Correct Answer:

Verified
Correct Answer:
Verified
Related Questions
Q1: i. In a time series analysis, the
Q2: Listed below is the net sales in
Q3: i. Long-term forecasts are usually from one
Q5: For an annual time series extending from
Q6: Which of the following is true for
Q8: You are trying to decide in which
Q9: For a three-year moving average, how many
Q10: Determine the expected value for the following
Q11: You have a decision to invest $10,000
Q70: If a quarterly seasonal index is 0.56,