Multiple Choice
Use the scatter diagrams to verify which statements are correct:
Chart A 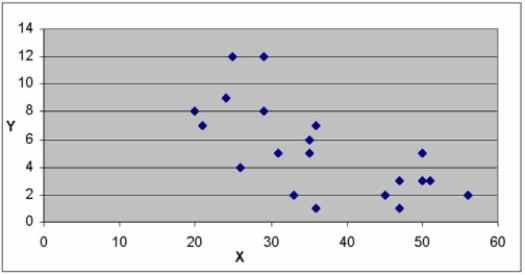
Chart B 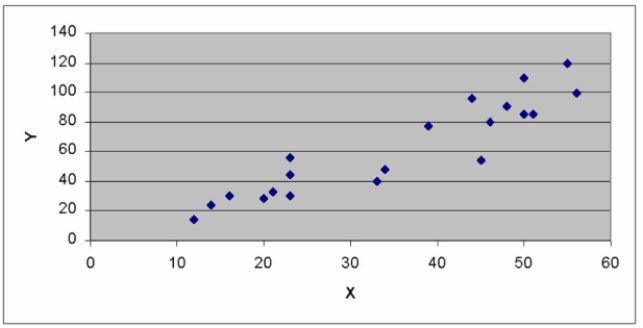
Chart C 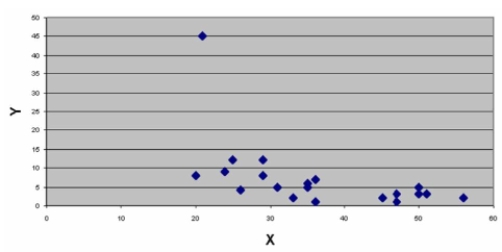
A) The variables in Chart A have a strong positive correlation.
B) The variables in Chart C have a strong positive correlation.
C) The variables in Chart B have a negative correlation.
D) Charts A & B have no obvious outliers.
Correct Answer:

Verified
Correct Answer:
Verified
Q103: Data is collected from 20 sales people
Q104: i. The strength of the correlation between
Q105: i. The purpose of correlation analysis is
Q106: i. The technique used to measure the
Q107: i. The coefficient of determination is the
Q109: The partial megastat output below is regression
Q110: What is the range of values for
Q111: Given the scatter diagram below, that shows
Q112: The partial megastat output below is regression
Q113: High school students were interested in a