Multiple Choice
The partial megastat output below is regression analysis of the relationship between annual payroll
And number of wins in a season for 28 teams in professional sports. The purpose of the analysis is
To predict the number of wins when given an annual payroll in $millions. Although technically not a
Sample, the baseball data below will be treated as a convenience sample of all major league
Professional sports. 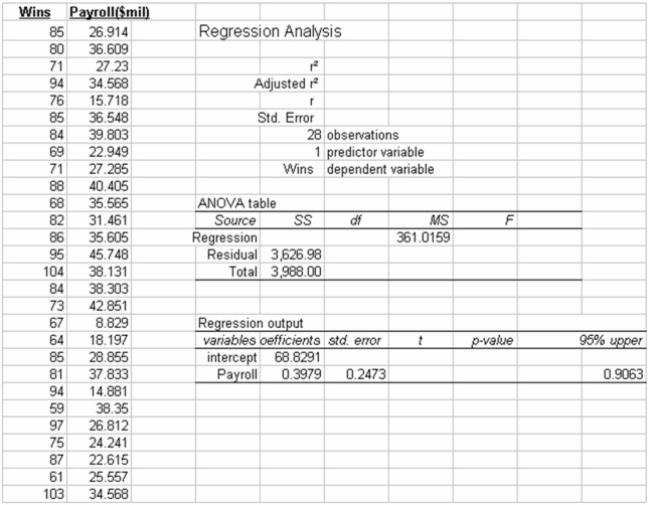
Refer to the printout above. The critical value of t, at the 5% level of significance, for testing the
Slope of the regression line is:
A) 2.056.
B) 1.706.
C) 1.314.
D) 1.703.
E) 1.061.
Correct Answer:

Verified
Correct Answer:
Verified
Q15: Based on the regression equation, we can<br>A)
Q107: i. The coefficient of determination is the
Q108: Use the scatter diagrams to verify which
Q109: The partial megastat output below is regression
Q110: What is the range of values for
Q111: Given the scatter diagram below, that shows
Q113: High school students were interested in a
Q115: i. A coefficient of correlation r close
Q116: The following table shows the number of
Q117: The difference between formulas for constructing a