Multiple Choice
A random sample of 30 executives from companies with assets over $1 million was selected and
Asked for their annual income and level of education. The following table summarized the results: 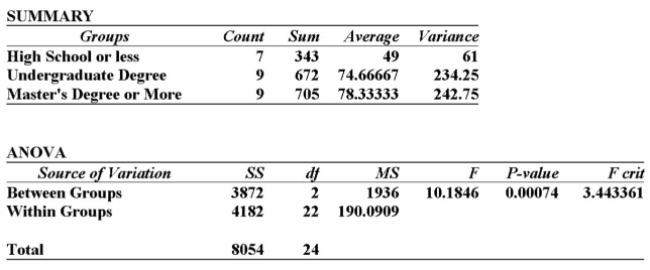
Using this output, what conclusions can you draw?
A) Since the calculated F-value is smaller than the F-critical value, there is a significant difference in the incomes of these 3 groups.
B) Since the calculated F-value is smaller than the F-critical value, there is no significant difference in the incomes of these three groups.
C) Since the P-value is 0.001, there is a 10% chance of these results happening when there is no significant difference in the incomes of these three groups.
D) Since the calculated F-value is larger than the F-critical value, and the P-value is so small, there is strong evidence to suggest that the three groups with different levels of education
Do not all have the same incomes.
E) Since the calculated F-value is larger than the F-critical value, and the P-value is so small, there is strong evidence to suggest that all three groups with different levels of education
Correct Answer:

Verified
Correct Answer:
Verified
Q74: i. If the computed value of F
Q75: A manufacturer of automobile transmissions uses three
Q76: In an effort to determine the most
Q77: Suppose a package delivery company purchased 14
Q78: The annual dividend rates for a random
Q80: A manufacturer of automobile transmissions uses three
Q81: In a study of low tar cigarettes,
Q82: i. If the computed value of F
Q83: Two accounting professors decided to compare the
Q84: Given the following Analysis of Variance table