Multiple Choice
A random sample of 30 executives from companies with assets over $1 million was selected and
Asked for their annual income and level of education. The ANOVA comparing the average income
Among three levels of education rejected the null hypothesis. The Mean Square Error (MSE) was
243) 7. The following table summarized the results: 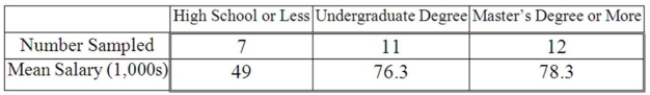
When comparing the mean annual incomes for executives with a High School education or less and
Undergraduate Degree, the 95% confidence interval shows an interval of 11.7 to 42.7 for the
Difference. This result indicates that:
A) there is no significant difference between the two incomes.
B) the interval contains a difference of zero.
C) executives with an Undergraduate Degree earn significantly more than executives with a High School education or less.
D) executives with an Undergraduate Degree earn significantly less than executives with a High School education or less.
Correct Answer:

Verified
Correct Answer:
Verified
Q65: A random sample of 30 executives from
Q66: Using the MegaStat printout below to compare
Q67: i. The F distribution is positively skewed
Q68: If the confidence interval for the difference
Q69: In a study of low tar cigarettes,
Q71: Two accounting professors decided to compare the
Q72: A manufacturer of automobile transmissions uses three
Q73: Two accounting professors decided to compare the
Q74: i. If the computed value of F
Q75: A manufacturer of automobile transmissions uses three