Multiple Choice
A random sample of 30 executives from companies with assets over $1 million was selected and
Asked for their annual income and level of education. The ANOVA comparing the average income
Among three levels of education rejected the null hypothesis. The Mean Square Error (MSE) was
243) 7. The following table summarized the results: 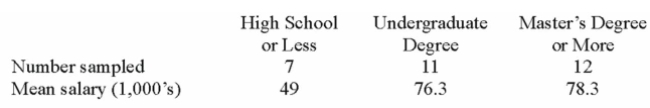
When comparing the mean annual incomes for executives with Undergraduate and Master's
Degree or more, the following 95% confidence interval can be constructed:
A) 2.0 ± 2.052*6.52
B) 2.0 ± 3.182*6.51
C) 2.0 ± 2.052*42.46
Correct Answer:

Verified
Correct Answer:
Verified
Q60: A manufacturer of automobile transmissions uses three
Q61: A manufacturer of automobile transmissions uses three
Q62: In an effort to determine the most
Q63: i. One characteristic of the F distribution
Q64: An ANOVA showed the following comparison of
Q66: Using the MegaStat printout below to compare
Q67: i. The F distribution is positively skewed
Q68: If the confidence interval for the difference
Q69: In a study of low tar cigarettes,
Q70: A random sample of 30 executives from