Multiple Choice
In the following graph, S and D represent the supply and demand curves respectively, in the labour market. Refer to the graph to answer the question. 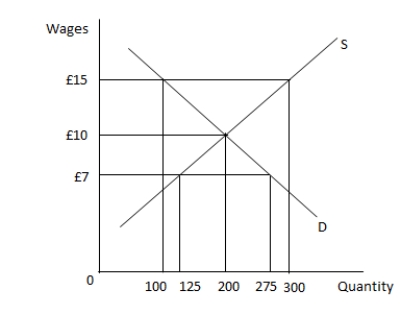 When the wage in the market is set at £15:
A) there is a surplus of 300 workers.
B) there is a shortage of 100 workers.
C) there is a surplus of 200 workers.
D) there is a shortage of 275 workers.
Correct Answer:

Verified
Correct Answer:
Verified
Q17: The International Labour Organization (ILO) defines employment
Q18: When does cost push in?ation occur in
Q19: When the wage in a market is
Q20: The Phillips curve shows the relationship between:<br>A)
Q21: How does in?ation targeting affect ?rms and
Q23: If the inflation rate is 6% per
Q24: List the three potential ways of measuring
Q25: A worker who loses his job due
Q26: Which of the following is true for
Q27: In the following graph, S and D