Multiple Choice
In the following graph, S and D represent the supply and demand curves respectively, in the labour market. Refer to the graph to answer the question. 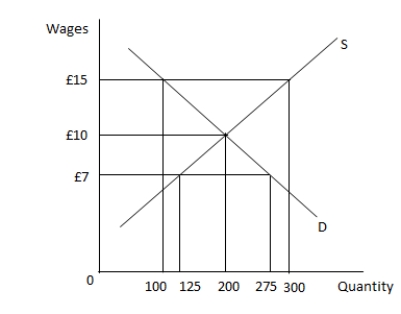 When the wage in the market is set at £7:
A) there is a surplus of 100 workers.
B) there is a shortage of 150 workers.
C) there is a surplus of 200 workers.
D) there is a shortage of 275 workers.
Correct Answer:

Verified
Correct Answer:
Verified
Q22: In the following graph, S and D
Q23: If the inflation rate is 6% per
Q24: List the three potential ways of measuring
Q25: A worker who loses his job due
Q26: Which of the following is true for
Q28: The claimant count in the UK is
Q29: National income at basic prices is calculated
Q30: Suppose the demand for construction jobs declines
Q31: Which of the following implies that the
Q32: The level of gross domestic product (GDP)