Multiple Choice
The graph shows the changing electrical charge of a neuron when it activates. Pick the alternative that correctly labels thedifferent phases depicted in the graph. 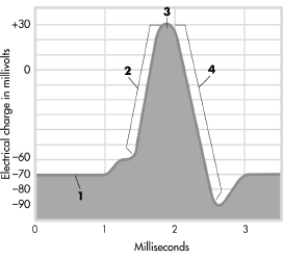
A) 1 = action potential, 2 = stimulus threshold, 3 = refractory period, 4 = resting potential
B) 1 = ions cross membrane, 2 = action potential, 3 = stimulus
C) thre 1 = dsholdep, 4 = dolarizatepionolariz, 2 = acationtion p Incootrrecential, 3 = stimt ulus threshold, 4 = repolarization
D) 1 = resting potential, 2 = ions cross membrane, 3 = action potential, 4 = refractory period
Correct Answer:

Verified
Correct Answer:
Verified
Q16: During the action potential:<br>A) the electrical charge
Q18: The implication of Pereira's study on exercise
Q21: Oligodendrocytes provide connections between neurons and blood
Q22: Randy exercises more than most people and
Q24: Oligodendrocytes and Schwann cells form the myelin
Q25: This image depicts the left hemisphere of
Q28: Current research shows that structural plasticity is
Q178: Epinephrine and norepinephrine are manufactured by the
Q222: Parkinson's disease often involves the degeneration of
Q341: A neuron's resting potential is due to