Multiple Choice
TABLE 2-4
A survey was conducted to determine how people rated the quality of programming available on television. Respondents were asked to rate the overall quality from 0 (no quality at all) to 100 (extremely good quality) . The stem-and-leaf display of the data is shown below.
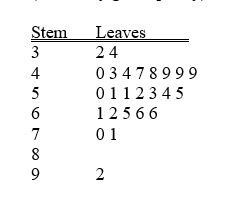
-Referring to Table 2-4, what percentage of the respondents rated overall television quality with a rating of 50 or below?
A) 11
B) 40
C) 44
D) 56
Correct Answer:

Verified
Correct Answer:
Verified
Q158: Histograms are used for numerical data while
Q165: Retailers are always interested in determining why
Q166: TABLE 2-11<br>The ordered array below resulted from
Q167: TABLE 2-18<br>The stem-and-leaf display below shows the
Q168: TABLE 2-11<br>The ordered array below resulted from
Q169: TABLE 2-14<br>The table below contains the number
Q171: TABLE 2-12<br>The table below contains the opinions
Q173: TABLE 2-14<br>The table below contains the number
Q174: A Wal-Mart store in a small town
Q175: TABLE 2-8<br>The Stem-and-Leaf display represents the number