True/False
TABLE 2-18
The stem-and-leaf display below shows the result of a survey on 50 students on their satisfaction with their school with the higher scores represent higher level of satisfaction.
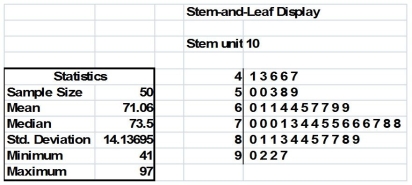
-Referring to Table 2-18, if a student is randomly selected, his/her most likely level of satisfaction will be in the 70s among the 40s, 50s, 60s, 70s, 80s and 90s.
Correct Answer:

Verified
Correct Answer:
Verified
Q158: Histograms are used for numerical data while
Q162: TABLE 2-8<br>The Stem-and-Leaf display represents the number
Q163: TABLE 2-9<br>The frequency distribution below represents the
Q164: TABLE 2-14<br>The table below contains the number
Q165: Retailers are always interested in determining why
Q166: TABLE 2-11<br>The ordered array below resulted from
Q168: TABLE 2-11<br>The ordered array below resulted from
Q169: TABLE 2-14<br>The table below contains the number
Q170: TABLE 2-4<br>A survey was conducted to determine
Q171: TABLE 2-12<br>The table below contains the opinions