Multiple Choice
TABLE 2-5
The following are the duration in minutes of a sample of long-distance phone calls made within the continental United States reported by one long-distance carrier. 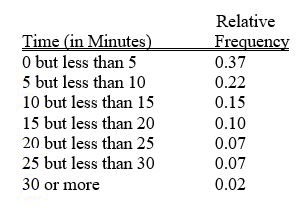
-Referring to Table 2-5, what is the cumulative relative frequency for the percentage of calls that lasted 10 minutes or more?
A) 0.16
B) 0.24
C) 0.41
D) 0.90
Correct Answer:

Verified
Correct Answer:
Verified
Q1: TABLE 2-7<br>The Stem-and-Leaf display below contains data
Q2: To determine the width of class interval,
Q4: TABLE 2-16<br>The figure below is the percentage
Q5: TABLE 2-10<br>The histogram below represents scores achieved
Q7: TABLE 2-14<br>The table below contains the number
Q8: TABLE 2-16<br>The figure below is the percentage
Q9: TABLE 2-7<br>The Stem-and-Leaf display below contains data
Q10: TABLE 2-7<br>The Stem-and-Leaf display below contains data
Q14: In general,grouped frequency distributions should have between
Q64: When polygons or histograms are constructed,which axis