Multiple Choice
TABLE 2-6
A sample of 200 students at a Big-Ten university was taken after the midterm to ask them whether they went bar hopping the weekend before the midterm or spent the weekend studying, and whether they did well or poorly on the midterm. The following table contains the result.
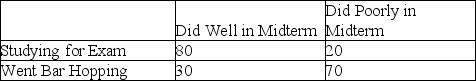
-Referring to Table 2-6, if the sample is a good representation of the population, we can expect ________ percent of the students in the population to spend the weekend studying and do poorly on the midterm.
A) 10
B) 20
C) 45
D) 50
Correct Answer:

Verified
Correct Answer:
Verified
Q118: A histogram can have gaps between the
Q155: TABLE 2-12<br>The table below contains the opinions
Q156: TABLE 2-8<br>The Stem-and-Leaf display represents the number
Q158: TABLE 2-12<br>The table below contains the opinions
Q161: A side-by-side chart is two histograms plotted
Q162: TABLE 2-8<br>The Stem-and-Leaf display represents the number
Q163: TABLE 2-9<br>The frequency distribution below represents the
Q164: Ogives are plotted at the midpoints of
Q164: TABLE 2-14<br>The table below contains the number
Q165: Retailers are always interested in determining why