Short Answer
TABLE 2-8
The Stem-and-Leaf display represents the number of times in a year that a random sample of 100 "lifetime" members of a health club actually visited the facility.
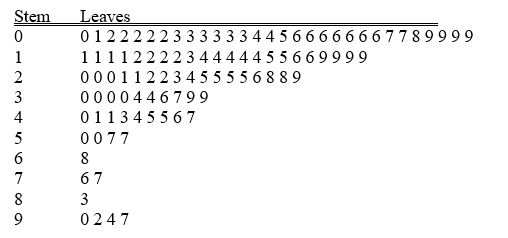
-Referring to Table 2-8, the person who visited the health club less than anyone else in the sample visited the facility ________ times.
Correct Answer:

Verified
Correct Answer:
Verified
Q118: A histogram can have gaps between the
Q158: TABLE 2-12<br>The table below contains the opinions
Q160: TABLE 2-6<br>A sample of 200 students at
Q161: A side-by-side chart is two histograms plotted
Q163: TABLE 2-9<br>The frequency distribution below represents the
Q164: Ogives are plotted at the midpoints of
Q164: TABLE 2-14<br>The table below contains the number
Q165: Retailers are always interested in determining why
Q166: TABLE 2-11<br>The ordered array below resulted from
Q167: TABLE 2-18<br>The stem-and-leaf display below shows the