Multiple Choice
TABLE 2-15
The figure below is the ogive for the amount of fat (in grams) for a sample of 36 pizza products where the upper boundaries of the intervals are: 5, 10, 15, 20, 25, and 30.
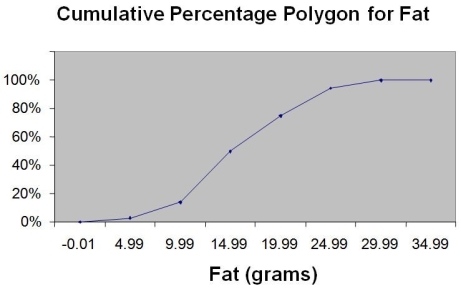
-Referring to Table 2-15, what percentage of pizza products contains at least 20 grams of fat?
A) 5%
B) 25%
C) 75%
D) 96%
Correct Answer:

Verified
Correct Answer:
Verified
Q47: The point halfway between the boundaries of
Q98: A polygon can be constructed from a
Q132: TABLE 2-12<br>The table below contains the opinions
Q134: Given below is the scatter plot of
Q135: You have collected data on the number
Q137: TABLE 2-14<br>The table below contains the number
Q139: You have collected data on the monthly
Q140: TABLE 2-14<br>The table below contains the number
Q141: TABLE 2-12<br>The table below contains the opinions
Q154: Which of the following is appropriate for