True/False
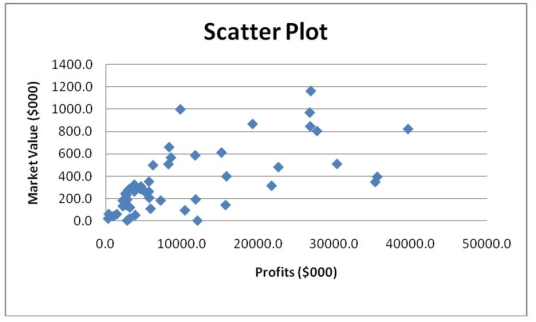
Given below is the scatter plot of the market value (thousands$) and profit (thousands$) of 50 U.S. companies. There appears to be a negative relationship between market value and profit.
Correct Answer:

Verified
Correct Answer:
Verified
Related Questions
Q47: The point halfway between the boundaries of
Q78: A_ is a summary table in which
Q98: A polygon can be constructed from a
Q129: TABLE 2-12<br>The table below contains the opinions
Q132: TABLE 2-12<br>The table below contains the opinions
Q135: You have collected data on the number
Q136: TABLE 2-15<br>The figure below is the ogive
Q137: TABLE 2-14<br>The table below contains the number
Q139: You have collected data on the monthly
Q154: Which of the following is appropriate for