Short Answer
TABLE 2-18
The stem-and-leaf display below shows the result of a survey on 50 students on their satisfaction with their school with the higher scores represent higher level of satisfaction.
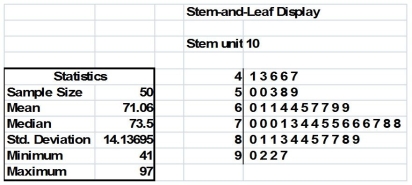
-Referring to Table 2-18, what was the lowest level of satisfaction?
Correct Answer:

Verified
Correct Answer:
Verified
Q41: The relative frequency is the frequency in
Q80: SCENARIO 2-1<br>An insurance company evaluates many numerical
Q83: TABLE 2-8<br>The Stem-and-Leaf display represents the number
Q84: TABLE 2-14<br>The table below contains the number
Q86: TABLE 2-2<br>At a meeting of information systems
Q88: TABLE 2-14<br>The table below contains the number
Q91: TABLE 2-10<br>The histogram below represents scores achieved
Q92: Data on the number of credit hours
Q111: SCENARIO 2-2<br>2-2 Organizing and Visualizing Variables<br>At a
Q140: The British Airways Internet site provides a