Multiple Choice
TABLE 10-13
The amount of time required to reach a customer service representative has a huge impact on customer satisfaction. Below is the Excel output from a study to see whether there is evidence of a difference in the mean amounts of time required to reach a customer service representative between two hotels. Assume that the population variances in the amount of time for the two hotels are not equal.
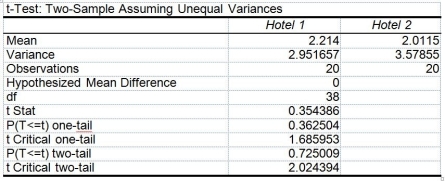
-Referring to Table 10-13, suppose α = 0.10. Which of the following represents the result of the relevant hypothesis test?
A) The alternative hypothesis is rejected.
B) The null hypothesis is rejected.
C) The null hypothesis is not rejected.
D) Insufficient information exists on which to make a decision.
Correct Answer:

Verified
Correct Answer:
Verified
Q188: A powerful women's group has claimed that
Q200: TABLE 10-15<br>The table below presents the summary
Q201: If we wish to determine whether there
Q202: TABLE 10-8<br>A few years ago, Pepsi invited
Q203: TABLE 10-9<br>The following Excel output contains the
Q204: TABLE 10-13<br>The amount of time required to
Q205: TABLE 10-3<br>A real estate company is interested
Q206: TABLE 10-11<br>The dean of a college is
Q208: TABLE 10-12<br>A quality control engineer is in
Q209: TABLE 10-15<br>The table below presents the summary