Multiple Choice
TABLE 13-8
It is believed that GPA (grade point average, based on a four point scale) should have a positive linear relationship with ACT scores. Given below is the Excel output for predicting GPA using ACT scores based a data set of 8 randomly chosen students from a Big-Ten university.
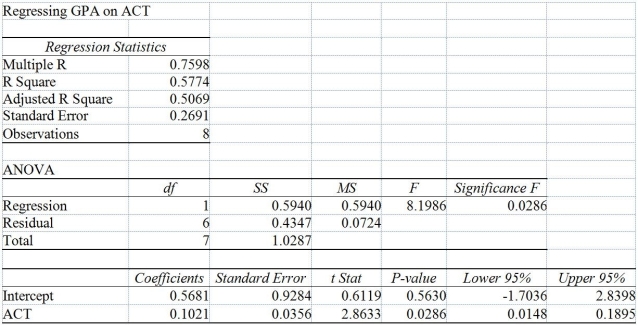
-Referring to Table 13-8, the interpretation of the coefficient of determination in this regression is
A) 57.74% of the total variation of ACT scores can be explained by GPA.
B) ACT scores account for 57.74% of the total fluctuation in GPA.
C) GPA accounts for 57.74% of the variability of ACT scores.
D) None of the above.
Correct Answer:

Verified
Correct Answer:
Verified
Q2: TABLE 13-4<br>The managers of a brokerage firm
Q3: TABLE 13-4<br>The managers of a brokerage firm
Q4: TABLE 13-13<br>In this era of tough economic
Q5: TABLE 13-7<br>An investment specialist claims that if
Q8: TABLE 13-2<br>A candy bar manufacturer is interested
Q9: Referring to Table 13-2, what is <img
Q10: TABLE 13-13<br>In this era of tough economic
Q11: TABLE 13-4<br>The managers of a brokerage firm
Q101: The Regression Sum of Squares (SSR)can never
Q198: The width of the prediction interval for