Multiple Choice
TABLE 15-1
A certain type of rare gem serves as a status symbol for many of its owners. In theory, for low prices, the demand increases and it decreases as the price of the gem increases. However, experts hypothesize that when the gem is valued at very high prices, the demand increases with price due to the status owners believe they gain in obtaining the gem. Thus, the model proposed to best explain the demand for the gem by its price is the quadratic model:
Y = β₀ + β₁X + β₁X² + ε
where Y = demand (in thousands) and X = retail price per carat.
This model was fit to data collected for a sample of 12 rare gems of this type. A portion of the computer analysis obtained from Microsoft Excel is shown below: 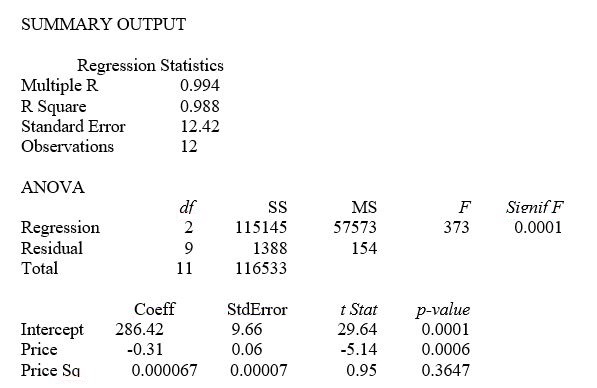
-Referring to Table 15-1, what is the value of the test statistic for testing whether there is an upward curvature in the response curve relating the demand (Y) and the price (X) ?
A) -5.14
B) 0.95
C) 373
D) None of the above.
Correct Answer:

Verified
Correct Answer:
Verified
Q32: In data mining where huge data sets
Q86: TABLE 15-6<br>Given below are results from the
Q87: TABLE 15-3<br>A chemist employed by a pharmaceutical
Q88: TABLE 15-6<br>Given below are results from the
Q88: TABLE 15-6<br>Given below are results from the
Q88: TABLE 15-6<br>Given below are results from the
Q89: An independent variable Xⱼ is considered highly
Q90: TABLE 15-3<br>A chemist employed by a pharmaceutical
Q92: TABLE 15-4<br> <img src="https://d2lvgg3v3hfg70.cloudfront.net/TB1602/.jpg" alt="TABLE 15-4
Q94: TABLE 15-4<br> <img src="https://d2lvgg3v3hfg70.cloudfront.net/TB1602/.jpg" alt="TABLE 15-4