True/False
TABLE 15-4

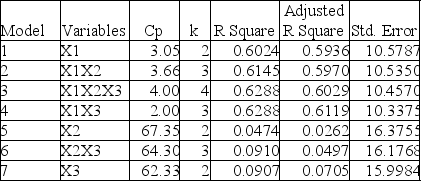
The output from the best-subset regressions is given below:

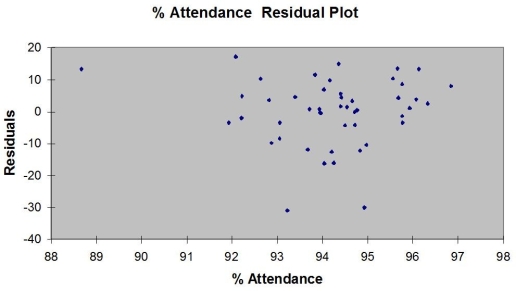
Following is the residual plot for % Attendance:

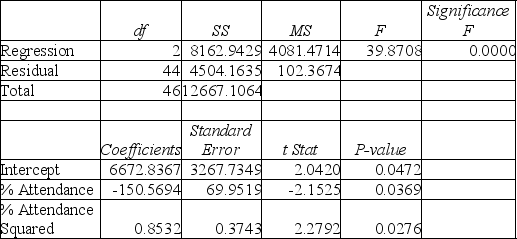
Following is the output of several multiple regression models:
Model (I):

Model (II):

Model (III):

-Referring to Table 15-4, the residual plot suggests that a nonlinear model on % attendance may be a better model.
Correct Answer:

Verified
Correct Answer:
Verified
Q32: In data mining where huge data sets
Q86: TABLE 15-6<br>Given below are results from the
Q87: TABLE 15-3<br>A chemist employed by a pharmaceutical
Q88: TABLE 15-6<br>Given below are results from the
Q88: TABLE 15-6<br>Given below are results from the
Q88: TABLE 15-6<br>Given below are results from the
Q89: An independent variable Xⱼ is considered highly
Q90: TABLE 15-3<br>A chemist employed by a pharmaceutical
Q92: TABLE 15-4<br> <img src="https://d2lvgg3v3hfg70.cloudfront.net/TB1602/.jpg" alt="TABLE 15-4
Q93: TABLE 15-1<br>A certain type of rare gem