Multiple Choice
TABLE 15-1
A certain type of rare gem serves as a status symbol for many of its owners. In theory, for low prices, the demand increases and it decreases as the price of the gem increases. However, experts hypothesize that when the gem is valued at very high prices, the demand increases with price due to the status owners believe they gain in obtaining the gem. Thus, the model proposed to best explain the demand for the gem by its price is the quadratic model:
Y = β₀ + β₁X + β₁X² + ε
where Y = demand (in thousands) and X = retail price per carat.
This model was fit to data collected for a sample of 12 rare gems of this type. A portion of the computer analysis obtained from Microsoft Excel is shown below: 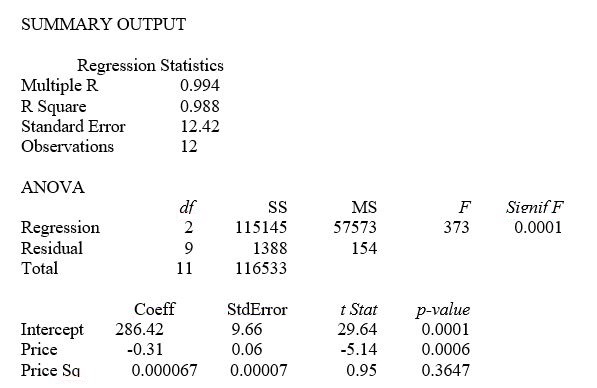
-Referring to Table 15-1, what is the correct interpretation of the coefficient of multiple determination?
A) 98.8% of the total variation in demand can be explained by the linear relationship between demand and price.
B) 98.8% of the total variation in demand can be explained by the quadratic relationship between demand and price.
C) 98.8% of the total variation in demand can be explained by the addition of the square term in price.
D) 98.8% of the total variation in demand can be explained by just the square term in price.
Correct Answer:

Verified
Correct Answer:
Verified
Q14: Two simple regression models were used to
Q15: TABLE 15-4<br> <img src="https://d2lvgg3v3hfg70.cloudfront.net/TB1602/.jpg" alt="TABLE 15-4
Q17: TABLE 15-4<br> <img src="https://d2lvgg3v3hfg70.cloudfront.net/TB1602/.jpg" alt="TABLE 15-4
Q19: Which of the following will not change
Q21: TABLE 15-4<br> <img src="https://d2lvgg3v3hfg70.cloudfront.net/TB1602/.jpg" alt="TABLE 15-4
Q22: TABLE 15-6<br>Given below are results from the
Q23: TABLE 15-4<br> <img src="https://d2lvgg3v3hfg70.cloudfront.net/TB1602/.jpg" alt="TABLE 15-4
Q36: The stepwise regression approach takes into consideration
Q42: So that we can fit curves as
Q88: TABLE 15-6<br>Given below are results from the