Short Answer
TABLE 15-4

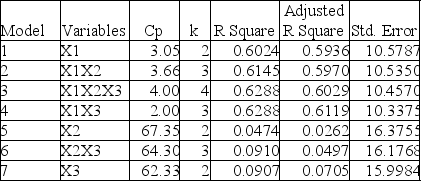
The output from the best-subset regressions is given below:

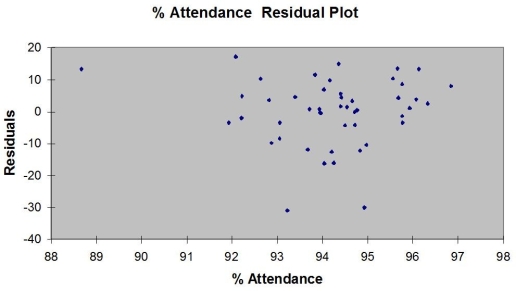
Following is the residual plot for % Attendance:

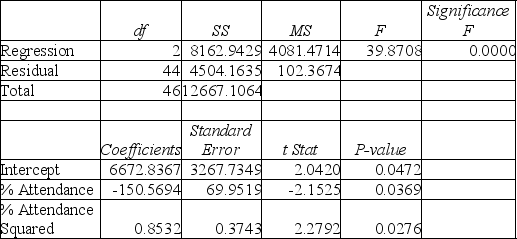
Following is the output of several multiple regression models:
Model (I):

Model (II):

Model (III):

-Referring to Table 15-4, what is the value of the test statistic to determine whether the quadratic effect of daily average of the percentage of students attending class on percentage of students passing the proficiency test is significant at a 5% level of significance?
Correct Answer:

Verified
Correct Answer:
Verified
Q12: TABLE 15-1<br>A certain type of rare gem
Q14: Two simple regression models were used to
Q15: TABLE 15-4<br> <img src="https://d2lvgg3v3hfg70.cloudfront.net/TB1602/.jpg" alt="TABLE 15-4
Q18: TABLE 15-1<br>A certain type of rare gem
Q19: Which of the following will not change
Q21: TABLE 15-4<br> <img src="https://d2lvgg3v3hfg70.cloudfront.net/TB1602/.jpg" alt="TABLE 15-4
Q22: TABLE 15-6<br>Given below are results from the
Q36: The stepwise regression approach takes into consideration
Q42: So that we can fit curves as
Q88: TABLE 15-6<br>Given below are results from the