Short Answer
TABLE 17-5
A manufacturer of computer disks took samples of 240 disks on 15 consecutive days. The number of disks with bad sectors was determined for each of these samples. The results are in the table that follows. 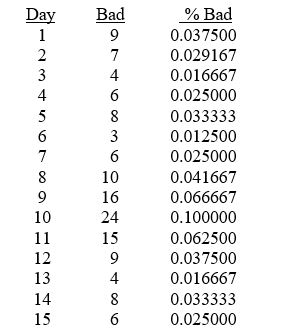
-Referring to Table 17-5, a p control chart is to be made for these data. The center line of the control chart is ________.
Correct Answer:

Verified
Correct Answer:
Verified
Q74: Referring to Table 17-4, suppose the supervisor
Q75: Referring to Table 17-7, what is the
Q76: TABLE 17-8<br>Recently, a university switched to a
Q79: TABLE 17-7<br>A supplier of silicone sheets for
Q80: TABLE 17-3<br>A quality control analyst for a
Q81: TABLE 17-1<br>A local newspaper has 10 delivery
Q82: Which of the following is not one
Q83: TABLE 17-9<br>The manufacturer of canned food constructed
Q125: Which of the following situations suggests a
Q156: The control limits are based on the