Multiple Choice
TABLE 17-3
A quality control analyst for a light bulb manufacturer is concerned that the time it takes to produce a batch of light bulbs is too erratic. Accordingly, the analyst randomly surveys 10 production periods each day for 14 days and records the sample mean and range for each day.
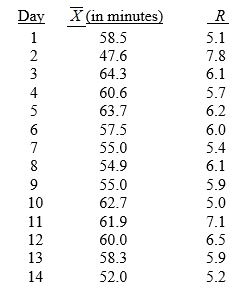
-Referring to Table 17-3, suppose the analyst constructs an R chart to see if the variability in production times is in-control. The R chart is characterized by which of the following?
A) Increasing trend
B) Decreasing trend
C) In-control
D) Points outside the control limits
Correct Answer:

Verified
Correct Answer:
Verified
Q75: Referring to Table 17-7, what is the
Q76: TABLE 17-8<br>Recently, a university switched to a
Q78: TABLE 17-5<br>A manufacturer of computer disks took
Q79: TABLE 17-7<br>A supplier of silicone sheets for
Q81: TABLE 17-1<br>A local newspaper has 10 delivery
Q82: Which of the following is not one
Q83: TABLE 17-9<br>The manufacturer of canned food constructed
Q84: TABLE 17-8<br>Recently, a university switched to a
Q85: Larger Cpk indicates larger capability of meeting
Q125: Which of the following situations suggests a