Short Answer
TABLE 17-5
A manufacturer of computer disks took samples of 240 disks on 15 consecutive days. The number of disks with bad sectors was determined for each of these samples. The results are in the table that follows. 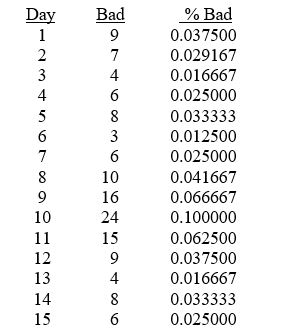
-Referring to Table 17-5, a p control chart is to be made for these data. The estimate of the standard error of the proportion of disks with bad sectors is ________.
Correct Answer:

Verified
0.03679//3...View Answer
Unlock this answer now
Get Access to more Verified Answers free of charge
Correct Answer:
Verified
View Answer
Unlock this answer now
Get Access to more Verified Answers free of charge
Q3: TABLE 17-8<br>Recently, a university switched to a
Q4: TABLE 17-8<br>Recently, a university switched to a
Q6: TABLE 17-7<br>A supplier of silicone sheets for
Q9: TABLE 17-9<br>The manufacturer of canned food constructed
Q10: TABLE 17-9<br>The manufacturer of canned food constructed
Q11: TABLE 17-6<br>The maker of a packaged candy
Q12: Determining the root causes of why defects
Q12: TABLE 17-7<br>A supplier of silicone sheets for
Q13: TABLE 17-8<br>Recently, a university switched to a
Q53: Common causes of variation are correctable without