Short Answer
TABLE 17-6
The maker of a packaged candy wants to evaluate the quality of her production process. On each of 16 consecutive days, she samples 600 bags of candy and determines the number in each day's sample that she considers to be of poor quality. The data that she developed follow. 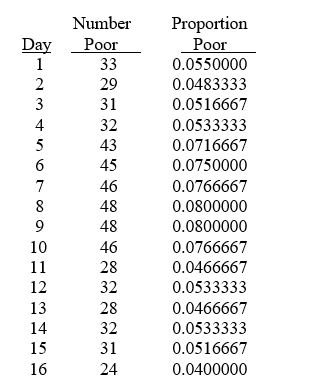
-Referring to Table 17-6, a p control chart is to be constructed for these data. The estimate of the standard error of the sample proportion is ________.
Correct Answer:

Verified
Correct Answer:
Verified
Q6: TABLE 17-7<br>A supplier of silicone sheets for
Q8: TABLE 17-5<br>A manufacturer of computer disks took
Q9: TABLE 17-9<br>The manufacturer of canned food constructed
Q10: TABLE 17-9<br>The manufacturer of canned food constructed
Q12: Determining the root causes of why defects
Q12: TABLE 17-7<br>A supplier of silicone sheets for
Q13: TABLE 17-8<br>Recently, a university switched to a
Q15: TABLE 17-2<br>A political pollster randomly selects a
Q16: TABLE 17-7<br>A supplier of silicone sheets for
Q133: Developing operational definitions for each critical-to-quality characteristic