Short Answer
TABLE 17-6
The maker of a packaged candy wants to evaluate the quality of her production process. On each of 16 consecutive days, she samples 600 bags of candy and determines the number in each day's sample that she considers to be of poor quality. The data that she developed follow. 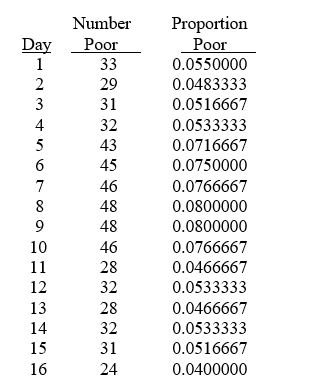
-Referring to Table 17-6, a p control chart is to be constructed for these data. The lower control limit is ________, while the upper control limit is ________.
Correct Answer:

Verified
0.0309139;...View Answer
Unlock this answer now
Get Access to more Verified Answers free of charge
Correct Answer:
Verified
View Answer
Unlock this answer now
Get Access to more Verified Answers free of charge
Q1: _ causes of variation are correctable without
Q85: Larger Cpk indicates larger capability of meeting
Q86: TABLE 17-3<br>A quality control analyst for a
Q88: TABLE 17-9<br>The manufacturer of canned food constructed
Q89: Referring to Table 17-7, what percentage of
Q91: TABLE 17-10<br>Below is the number of defective
Q93: TABLE 17-9<br>The manufacturer of canned food constructed
Q95: TABLE 17-7<br>A supplier of silicone sheets for
Q118: An in-control process must be achieved before
Q119: The smaller the capability index,the more capable