Multiple Choice
TABLE 17-3
A quality control analyst for a light bulb manufacturer is concerned that the time it takes to produce a batch of light bulbs is too erratic. Accordingly, the analyst randomly surveys 10 production periods each day for 14 days and records the sample mean and range for each day.
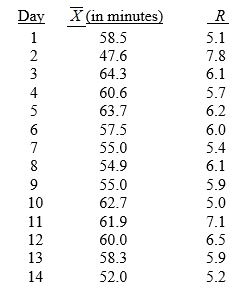
-Referring to Table 17-3, suppose the sample mean and range data were based on 11 observations per day instead of 10. How would this change affect the lower and upper control limits of the R chart?
A) LCL would increase; UCL would decrease.
B) LCL would remain the same; UCL would decrease.
C) Both LCL and UCL would remain the same.
D) LCL would decrease; UCL would increase.
Correct Answer:

Verified
Correct Answer:
Verified
Q81: TABLE 17-1<br>A local newspaper has 10 delivery
Q82: Which of the following is not one
Q83: TABLE 17-9<br>The manufacturer of canned food constructed
Q84: TABLE 17-8<br>Recently, a university switched to a
Q85: Larger Cpk indicates larger capability of meeting
Q88: TABLE 17-9<br>The manufacturer of canned food constructed
Q89: Referring to Table 17-7, what percentage of
Q90: TABLE 17-6<br>The maker of a packaged candy
Q91: TABLE 17-10<br>Below is the number of defective
Q118: An in-control process must be achieved before