Short Answer
TABLE 17-8
Recently, a university switched to a new type of computer-based registration. The registrar is concerned with the amount of time students are spending on the computer registering under the new system. She decides to randomly select 8 students on each of the 12 days of the registration and determine the time each spends on the computer registering. The range, mean, and standard deviation of the times required to register are in the table that follows. 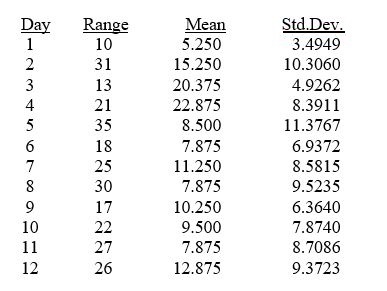
-Referring to Table 17-8, an  chart is to be used for the time required to register. The center line of this chart is located at ________.
Correct Answer:

Verified
Correct Answer:
Verified
Q55: The R chart is a control chart
Q60: TABLE 17-1<br>A local newspaper has 10 delivery
Q61: The Cp index measures the potential of
Q63: The CPL and CPU indexes are used
Q64: TABLE 17-9<br>The manufacturer of canned food constructed
Q65: Referring to Table 17-7, an <img src="https://d2lvgg3v3hfg70.cloudfront.net/TB1602/.jpg"
Q67: TABLE 17-8<br>Recently, a university switched to a
Q71: The Shewhart-Deming cycle plays an important role
Q73: Common causes of variation represent variation due
Q139: Variation due to the inherent variability in