Short Answer
TABLE 17-9
The manufacturer of canned food constructed control charts and analyzed several quality characteristics. One characteristic of interest is the weight of the filled cans. The lower specification limit for weight is 2.95 pounds. The table below provides the range and mean of the weights of five cans tested every fifteen minutes during a day's production.
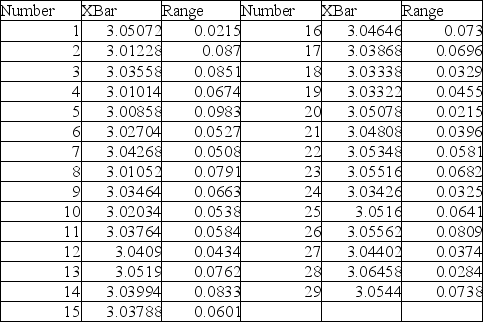
-Referring to Table 17-9, an R chart is to be constructed for the weight. One way to create the upper control limit involves multiplying the mean of the sample ranges by D₄. For this data set, the value of D₄ is ________.
Correct Answer:

Verified
Correct Answer:
Verified
Q55: The R chart is a control chart
Q60: TABLE 17-1<br>A local newspaper has 10 delivery
Q61: The Cp index measures the potential of
Q62: TABLE 17-8<br>Recently, a university switched to a
Q63: The CPL and CPU indexes are used
Q65: Referring to Table 17-7, an <img src="https://d2lvgg3v3hfg70.cloudfront.net/TB1602/.jpg"
Q67: TABLE 17-8<br>Recently, a university switched to a
Q69: Referring to Table 17-4, suppose the supervisor
Q71: The Shewhart-Deming cycle plays an important role
Q135: The purpose of a control chart is