Multiple Choice
(Figure: Understanding Surplus and Efficiency) In the graph, efficiency in this market is achieved at a price of 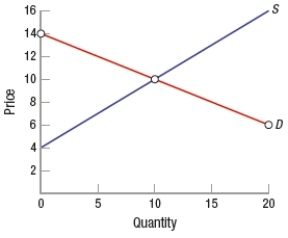
A) $14.
B) $10.
C) $4.
D) $0.
Correct Answer:

Verified
Correct Answer:
Verified
Related Questions
Q30: When prices rise above equilibrium<br>A) producer surplus
Q31: (Figure: Determining Surplus and Loss) Consider the
Q32: (Figure: Determining Surplus 6) Using the graph,
Q33: Producer surplus is the difference between the<br>A)
Q34: The difference between the demand curve and
Q36: Yulhee buys and wears a certain perfume
Q37: Why are prices above equilibrium considered to
Q38: Total surplus is maximized at a price
Q39: Producer surplus is the<br>A) difference between market
Q40: Vanessa is irritated at her roommate, Carol.