Multiple Choice
(Figure: Determining Surplus 6) Using the graph, we can calculate the maximum possible producer surplus as 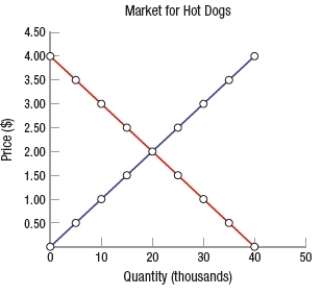
A) $10,000.
B) $20,000.
C) $40,000.
D) $80,000.
Correct Answer:

Verified
Correct Answer:
Verified
Related Questions
Q27: When demand for a product falls, ceteris
Q28: If a price floor is set below
Q29: Market failure means that<br>A) the market has
Q30: When prices rise above equilibrium<br>A) producer surplus
Q31: (Figure: Determining Surplus and Loss) Consider the
Q33: Producer surplus is the difference between the<br>A)
Q34: The difference between the demand curve and
Q35: (Figure: Understanding Surplus and Efficiency) In the
Q36: Yulhee buys and wears a certain perfume
Q37: Why are prices above equilibrium considered to