Multiple Choice
(Figure: Sales and Advertising) The graph shows the advertising expenditures and the resulting sales (in bottles) of a new caffeinated beverage called Jump. If consumer tastes change in the region where Jump is marketed and base sales increase by 1,500 bottles, what is the equation of the shifted line? 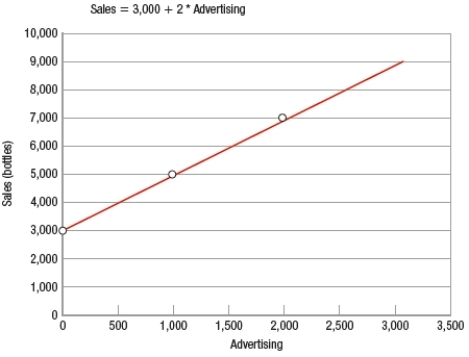
A) sales = 1,500 + 2 × advertising
B) sales = 3,000 + 2 × advertising
C) sales = 3,000 + 1,502 × advertising
D) sales = 4,500 + 2 × advertising
Correct Answer:

Verified
Correct Answer:
Verified
Q249: When specialization is used<br>A) society is more
Q250: Allocative inefficiency implies that<br>A) goods are produced
Q251: What are some examples of the types
Q252: (Figure: Interpreting Equations on a Graph) The
Q253: John chose to buy a pizza. If
Q255: It is impossible to have a conflict
Q256: International finance is generally studied in<br>A) microeconomics.<br>B)
Q257: The opportunity cost of buying a ticket
Q258: The concept of scarcity<br>A) exists in all
Q259: Government policy to achieve high employment may