Multiple Choice
(Figure: Interpreting Equations on a Graph) The graph illustrates 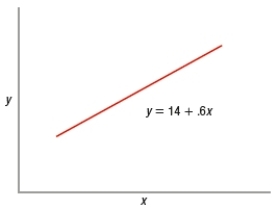
A) a nonlinear equation.
B) a linear equation.
C) the concept of efficiency.
D) a rectangular hyperbola.
Correct Answer:

Verified
Correct Answer:
Verified
Related Questions
Q247: The basic idea of opportunity cost is
Q248: Positive questions involve the understanding of basic
Q249: When specialization is used<br>A) society is more
Q250: Allocative inefficiency implies that<br>A) goods are produced
Q251: What are some examples of the types
Q253: John chose to buy a pizza. If
Q254: (Figure: Sales and Advertising) The graph shows
Q255: It is impossible to have a conflict
Q256: International finance is generally studied in<br>A) microeconomics.<br>B)
Q257: The opportunity cost of buying a ticket