Multiple Choice
(Figure: Graph Interpretation) In the graph, _____ is the dependent variable and the slope of the line is _____. 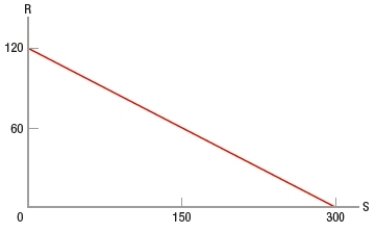
A) R; negative
B) R; positive
C) S; negative
D) S; positive
Correct Answer:

Verified
Correct Answer:
Verified
Related Questions
Q153: Time series graphs allow us to see
Q154: Which example represents a bad incentive?<br>A) charging
Q155: Macroeconomics studies the outcomes of individual markets
Q156: Economists look for rational responses to incentives.
Q157: When two variables appear to be related
Q159: The government can always successfully intervene in
Q160: (Figure: Graph Interpretation) In the graph, a
Q161: If you plot temperature on the y
Q162: Positive questions are questions about how things
Q163: (Table) Using the information in the table,