Multiple Choice
(Table) Using the information in the table, the equation that represents the relationship between temperature (T) on the horizontal axis and hot chocolate (C) sales on the vertical axis would be 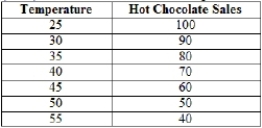
A) C = 150 - 2T
B) C = 50 - 1/2T
C) T = 75 - 2C
D) T = 25 - 1/2C
Correct Answer:

Verified
Correct Answer:
Verified
Q158: (Figure: Graph Interpretation) In the graph, _
Q159: The government can always successfully intervene in
Q160: (Figure: Graph Interpretation) In the graph, a
Q161: If you plot temperature on the y
Q162: Positive questions are questions about how things
Q164: Economists create simplistic models in order to
Q165: Changes in stock prices are correlated with
Q166: Economics deals only with financial issues.
Q167: What are some ways a person uses
Q168: The concept of equity relates to how