Multiple Choice
Consider the demand curve in the graph shown. What is the price elasticity of demand between a price of $4 and $6? 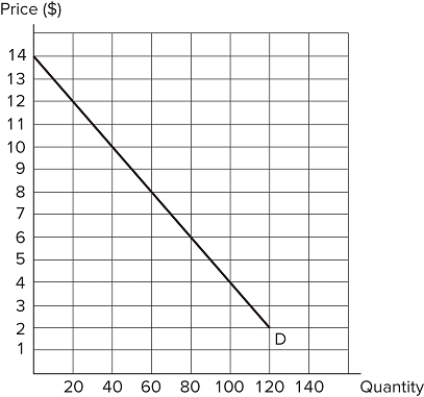
A) −0.45
B) −2.20
C) −0.18
D) −0.40
Correct Answer:

Verified
Correct Answer:
Verified
Related Questions
Q109: The demand for shoes is _ price
Q110: Suppose the price elasticity of demand for
Q111: If the price of a DVD decreases
Q112: Suppose the price of cereal increases by
Q113: Demand for a good is inelastic if:<br>A)
Q115: A decrease in price:<br>A) causes a decrease
Q116: A horizontal demand curve indicates that:<br>A) quantity
Q117: <img src="https://d2lvgg3v3hfg70.cloudfront.net/TB8194/.jpg" alt=" Consider the market
Q118: The cross-price elasticity of demand between peanut
Q119: Income elasticity will be positive for:<br>A) all