Multiple Choice
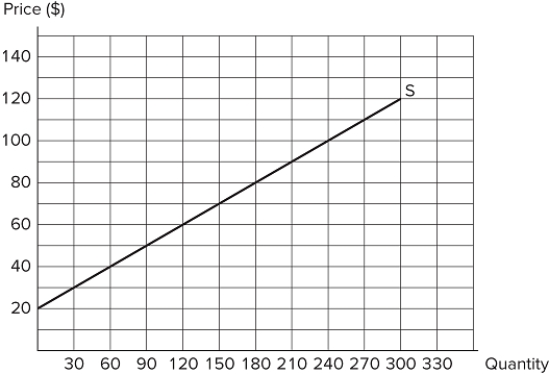 Consider the market in the graph shown. Using the mid-point method, what is the price elasticity of supply when the price increases from $40 to $60?
A) 1.67
B) 0.4
C) 0.67
D) 0.60
Correct Answer:

Verified
Correct Answer:
Verified
Related Questions
Q112: Suppose the price of cereal increases by
Q113: Demand for a good is inelastic if:<br>A)
Q114: Consider the demand curve in the graph
Q115: A decrease in price:<br>A) causes a decrease
Q116: A horizontal demand curve indicates that:<br>A) quantity
Q118: The cross-price elasticity of demand between peanut
Q119: Income elasticity will be positive for:<br>A) all
Q120: If the price of a good increases
Q121: If a small percentage change in price
Q122: If consumers spend more money on coffee