Multiple Choice
 Suppose the graph shown depicts the demand for a normal good. A shift from A to B might be caused by:
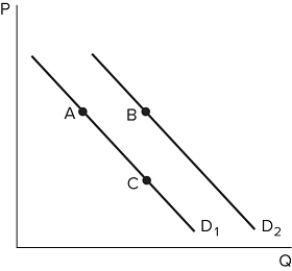
A) a decrease in the price of a substitute.
B) a decrease in the price of a complement.
C) an increase in the price of a complement.
D) an increase in the good's price.
Correct Answer:

Verified
Correct Answer:
Verified
Q105: The demand schedule assumes that factors other
Q106: Suppose the price of gasoline has recently
Q107: Suppose the demand for socks has decreased.
Q108: The supply curve is a(n) _ line
Q109: A change in a non-price factor of
Q111: The demand curve is a(n) _ line
Q112: <img src="https://d2lvgg3v3hfg70.cloudfront.net/TB8194/.jpg" alt=" The graph shown
Q113: A decrease in the price of spaghetti
Q114: What is a supply curve?<br>A) A graphical
Q115: The equilibrium price is sometimes called the:<br>A)