Multiple Choice
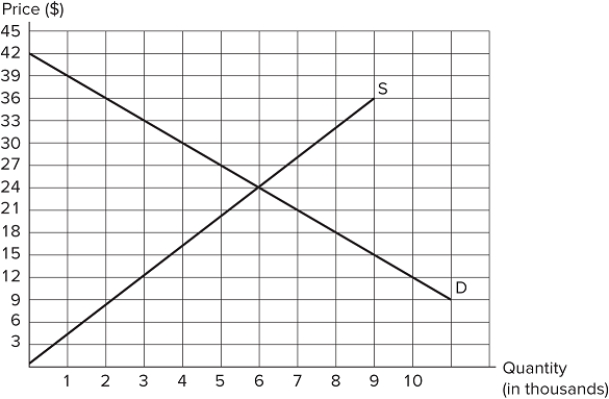 The graph shown depicts the market for a good. Suppose the government sets the price of this good at $36. At this price, there is:
A) a surplus (excess supply) of 9,000 units.
B) a shortage (excess demand) of 2,000 units.
C) a shortage (excess demand) of 7,000 units.
D) a surplus (excess supply) of 7,000 units.
Correct Answer:

Verified
Correct Answer:
Verified
Q107: Suppose the demand for socks has decreased.
Q108: The supply curve is a(n) _ line
Q109: A change in a non-price factor of
Q110: <img src="https://d2lvgg3v3hfg70.cloudfront.net/TB8194/.jpg" alt=" Suppose the graph
Q111: The demand curve is a(n) _ line
Q113: A decrease in the price of spaghetti
Q114: What is a supply curve?<br>A) A graphical
Q115: The equilibrium price is sometimes called the:<br>A)
Q116: Bob just got laid off from his
Q117: Supply describes how much of something producers:<br>A)