Multiple Choice
 The graph shown depicts the market for a good. What state is this market in if the price of the good is $5?
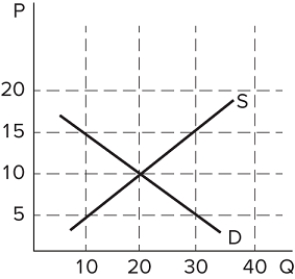
A) There is a shortage (excess demand) , signaling that sellers should leave the market.
B) There is a shortage (excess demand) , signaling that buyers should bid up the price.
C) There is a surplus (excess supply) , signaling that sellers should drop their price.
D) There is a surplus (excess supply) , signaling that buyers should bid up the price.
Correct Answer:

Verified
Correct Answer:
Verified
Q158: If a producer incorrectly sets the price
Q159: The demand curve represents the relationship between
Q160: Equilibrium exists at the point where:<br>A) quantity
Q161: Suppose the price of oil has recently
Q162: <img src="https://d2lvgg3v3hfg70.cloudfront.net/TB8194/.jpg" alt=" The graph shown
Q164: Which of the following is not a
Q165: <img src="https://d2lvgg3v3hfg70.cloudfront.net/TB8194/.jpg" alt=" Assume the graph
Q166: The demand for Snickers candy bars will
Q167: How should you plot a supply curve
Q168: Suppose irregular weather patterns caused very poor