Multiple Choice
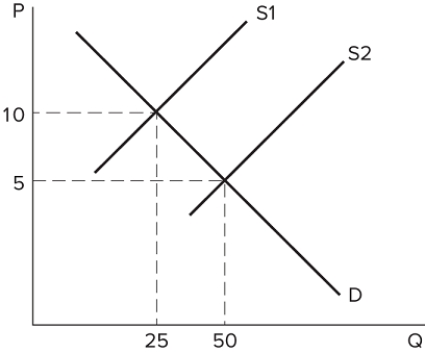 The graph shown depicts the market for a good. Assume the market was originally in equilibrium where the demand curve (D) and supply curve (S2) intersect. Something changes in the market, and the supply curve shifts to S1. What could have caused this shift?
A) The price of pizza sauce increased.
B) The price of pizza decreased.
C) The price of labor for pizza shops decreased.
D) Consumers no longer prefer to eat pizza.
Correct Answer:

Verified
Correct Answer:
Verified
Q157: <img src="https://d2lvgg3v3hfg70.cloudfront.net/TB8194/.jpg" alt=" The table shows
Q158: If a producer incorrectly sets the price
Q159: The demand curve represents the relationship between
Q160: Equilibrium exists at the point where:<br>A) quantity
Q161: Suppose the price of oil has recently
Q163: <img src="https://d2lvgg3v3hfg70.cloudfront.net/TB8194/.jpg" alt=" The graph shown
Q164: Which of the following is not a
Q165: <img src="https://d2lvgg3v3hfg70.cloudfront.net/TB8194/.jpg" alt=" Assume the graph
Q166: The demand for Snickers candy bars will
Q167: How should you plot a supply curve