Multiple Choice
The following figure gives the density function for the velocities of cars passing a checkpoint on a freeway. What percent of the cars drove less than 60 mph? 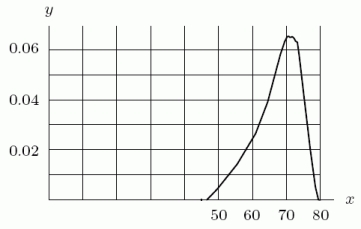
A) 5%
B) 15%
C) 25%
D) 35%
Correct Answer:

Verified
Correct Answer:
Verified
Related Questions
Q18: A professor far away from here gives
Q19: Each of the following density functions represents
Q20: An aptitude test is given to a
Q21: Let p(t) be a probability density
Q22: The density function for the time to
Q24: In the following probability density function, is
Q25: The probability of waiting no more than
Q26: The following figure gives the density function
Q27: Using the following figure, calculate the value
Q28: A density function for the age of