Short Answer
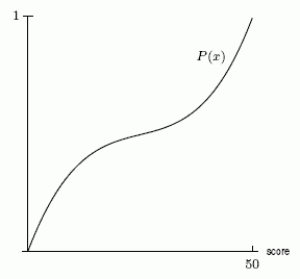
An aptitude test is given to a group of students. Scores can range from 0 to 50. Does the cumulative distribution function in the second graph correspond to the density function in the first graph? Answer "yes" or "no" 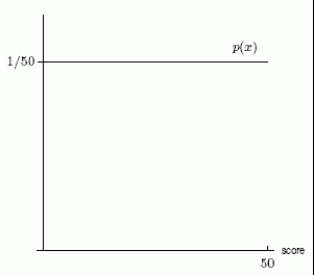
Correct Answer:

Verified
Correct Answer:
Verified
Related Questions
Q15: A banana plant typically has about 40
Q16: The heights, in inches, of flowers in
Q17: The density function and the cumulative distribution
Q18: A professor far away from here gives
Q19: Each of the following density functions represents
Q21: Let p(t) be a probability density
Q22: The density function for the time to
Q23: The following figure gives the density function
Q24: In the following probability density function, is
Q25: The probability of waiting no more than