Short Answer
The graph of a probability density function is given. Sketch a graph of the cumulative distribution function. 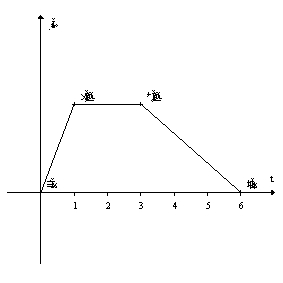
Correct Answer:

Verified
Correct Answer:
Verified
Related Questions
Q25: The probability of waiting no more than
Q26: The following figure gives the density function
Q27: Using the following figure, calculate the value
Q28: A density function for the age of
Q29: The following figure gives the density function
Q31: The density function for lunch time taken
Q32: The speed of cars on a freeway
Q33: A density function for the daily calorie
Q34: The race times for a group of
Q35: Which of the following distributions best describe